Blog Details
Home / Blog Details

🏘️ Is the Calgary Market Crashing? (December 2025 Update)
Dec 8, 2025
- 0
🏘️ Is the Calgary Market Crashing? (December 2025 Update)
The short answer is: No. However, the market is behaving in a way that surprises most people.
Backed by 21 years of data, the reality is that Calgary is not one single market right now—it is
experiencing four different markets simultaneously based on property type (Apartments,
Townhomes, Semi-Detached, and Detached).
Below is a detailed breakdown of the mortgage landscape, current statistics, and strategic
opportunities for buyers and sellers.
📅 Mortgage Renewals & Interest Rate TimelineWe are currently in a critical window for interest rates and renewals. A massive wave of renewals is
hitting Calgary, prompting many households to restructure their finances or move.
The Renewal Wave
Metric Data / Estimate
Total Mortgages (Calgary) ~280,000 – 285,000
Renewing in 2025–2026 ~170,000 Households
Why it matters Renewals trigger decisions: Upsizing, Downsizing, or Refinancing.
Interest Rate TrajectoryIf you are waiting for the “bottom,” we are likely already there.
2024: Rates began dropping.
Early 2025: Rates lowered to 2.75%.
Late 2025 (Current): Rates lowered to 2.25% (The likely floor).
2026 Forecast: Rates expected to remain flat.
2027 Forecast: Rates expected to begin rising again.
💡 Insight: If you are renewing a mortgage from the 1.3%–1.8% era, you will feel an increase,
but due to recent cuts, it is far more manageable than previous projections.
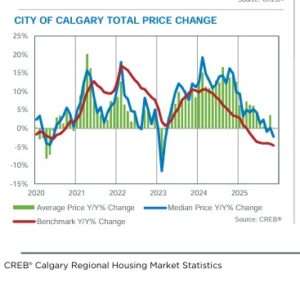
📉 December 2025 Market Snapshot
The gap between inventory (supply) and sales (demand) has widened significantly compared to
the tight market years of 2021–2023.
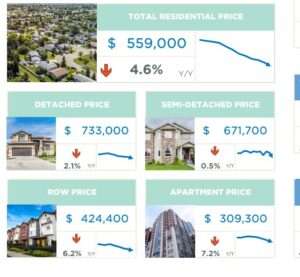
Statistic Current Value Year-over-Year Change Status
Benchmark Price $559,000 ⬇️ 4.5% – 4.6% Price Adjustment
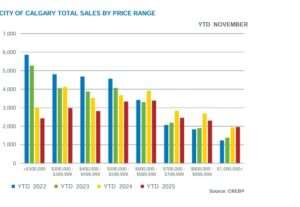
New Listings 2,251 ⬇️ (Seasonal Drop) Normal Winter Trend
Total Inventory 5,581 ⬇️ from 6,400 (Nov) Manageable Supply
Sales 1,553 ⬇️ 13% Lower volume, but not a crash
Months of Inventory 3.59 ↔️ Balanced Leaning slightly to Buyer’s Mkt
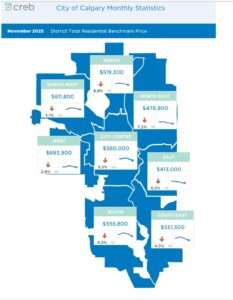
Regional Performance Trends
Not every neighbourhood is reacting the same way. Property mix and new construction volumes
are driving these regional differences.
Region Price Trend Primary Drivers
North / Northeast / East 📉 Largest Drops Higher volume of new builds; price sensitivity.
West / Northwest 🛡️ Smallest Drops Retaining value better; lower inventory pressure.
🚀 The Move-Up Opportunity (Strategy)
There is a unique “sweet spot” in the market right now for those looking to upgrade. This creates a
rare scenario where you can sell in a stronger market segment and buy in a softer one.
Case Study: The Move-Up MathIf you bought a detached home a few years ago for $500k, here is how the math works in
December 2025:
Transaction Side Price Range Market Conditions Months of Inventory
SELLING Your Home $650k – $750k Seller’s Market 🔥 ~2.4 Months (Fast Sale)
BUYING New Home $900k – $1M Balanced Market ⚖️ ~3.5 Months (Negotiation Power)
✅ The Strategy: You utilize the equity gain from your current home (selling where demand is high)
and upgrade to a luxury bracket where inventory is higher, giving you more choice and negotiating
power.
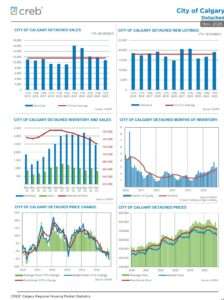
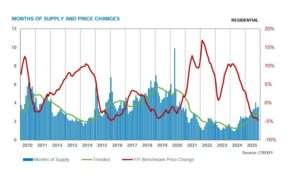
 📊 Market Mood: Months of Inventory (MOI)
The Months of Inventory (MOI) ratio tells us how long it would take to sell all current listings at the
current rate of sales.
Current MOI: 3.59 Months
The Trend: For the first time recently, the 30-day MOI is higher than the 90-day MOI.
Meaning: The short-term trend is leaning toward softer conditions (better for buyers),
though detached and semi-detached homes are still being absorbed quickly.
If you need specific data on your neighbourhood or want the full downloadable report with charts,
check the link in the description